
We all know that periodic load tests are vital if you want to avoid unpleasant surprises and regressions. Therefore, in this fast-paced agile age, it’s becoming increasingly important to integrate load testing into your continuous integration process. Including load testing in your application build process will allow you to:
- Catch performance regressions early
- Understand the impact of adding new features on your application’s performance
- Catch performance issues when versions of the underlying dependencies change
- Deploy with confidence
This blog post will explore this integration process further with a Bamboo continuous integration tutorial, where we will show you how to integrate load tests from Apache JMeter into Atlassian’s Bamboo.
Table of Contents:
- What is Atlassian Bamboo?
- The Challenges of Using Bamboo With JMeter
- Bamboo Continuous Integration Tutorial: Installing the Bamboo JMeter Aggregator Plugin
- How to Run a JMeter Test With Bamboo
- Integrating JMeter Load Tests into Bamboo CI
What is Atlassian Bamboo?
Atlassian Bamboo is one of the most popular continuous integration, release and build servers around today.
Due to its widespread popularity, today we’re going to focus on how to integrate load testing into your Continuous Integration process with Bamboo.
So, if your application build uses Bamboo, keep on reading!
The Challenges of Using Bamboo With JMeter
When trying to integrate JMeter with Bamboo we must first understand that this capability is not supported out of the box. However, there is a way for this integration to be accomplished, by performing the following:
- Adding a build step in Bamboo to trigger a JMeter test.
- Fetching the results from the Bamboo server of the build agent.
- Analyzing them to decide whether the build is good to go or not.
This is a feasible approach – but far from ideal! It’s much better to automate the analysis step so you can get immediate notifications whenever a threshold has been exceeded or if an SLA is violated.
Therefore, if you’re using JMeter with Bamboo, it’s crucial to install the Bamboo JMeter Aggregator plugin.
Bamboo Continuous Integration Tutorial: Installing the Bamboo JMeter Aggregator Plugin
Setting up the Bamboo JMeter Aggregator Plugin is a relatively simple process. You can get the plugin up and running in just six steps:
1. Download the latest version of the JMeter Aggregator plugin from the Atlassian Marketplace.
2. Stop the Bamboo server.
3. Copy the atlassian-bamboo-jmeter-aggregator-x.x.x.jar to the /atlassian-bamboo/WEB-INF/lib folder of your Bamboo installation.
4. Start the Bamboo server.
5. Validate that the plugin has been successfully installed with the Bamboo Plugin manager. Just click the “Administration” dropdown and select “Add-ons”.
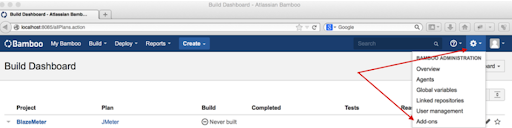
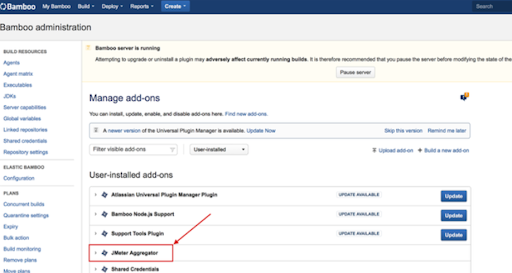
6. Check the “JMeter Aggregator” is in the list of the installed plugins.
How to Run a JMeter Test With Bamboo
Now, it’s pretty easy to add a JMeter test run to Bamboo.
Like any efficient continuous integration system, Bamboo executes tasks and checks their status (Note: a task is a small discrete unit of work that is usually run in Bamboo’s job context). Bamboo supports various task types, from single commands or shell scripts to much more complex activities like performing a Visual Studio or Xcode build.
The most popular way to launch JMeter is through the command-line non-GUI mode – and this is the approach I’ll be taking today.
First of all, let’s add an empty Command Line task to run a JMeter test in your Bamboo project.
- Click the “Edit” icon (the one with the pencil) on the right-hand side of your project.
- Click the Job where you would like to add your JMeter tests.
- Click the “Add Task” button.
- Choose a “Script” from the list (or enter the word “script” in the Search input).
Before we continue with populating the script body, it’s important to remember the following:
- The test result file should be located in the working directory of the Bamboo build agent. So you need to “tell” JMeter to store the results in Bamboo’s Job working folder.
- The test result file needs to be in an XML format. By default, JMeter stores its results in a CSV format so you’ll need to change it.
Therefore, add the following lines to the “Script body” area:
/bin/bash -c "/tmp/jmeter/bin/jmeter.sh \-Jjmeter.save.saveservice.output_format=xml \-n -t /tmp/tests/example.jmx \-l ${bamboo.build.working.directory}/example.jtl"
Let us break down the above code:
- /bin/bash = the system command interpreter.
- /tmp/jmeter/bin/jmeter.sh = the path to the JMeter executable script.
- -Jjmeter.save.saveservice.output_format=xml = the property which changes the JMeter result file format to XML. See the Apache JMeter Properties Customization Guide for more information on working with JMeter properties.
- /tmp/tests/example.jmx – the path to your JMeter test script.
- ${bamboo.build.working.directory} – the Bamboo variable which stands for the current build working directory.
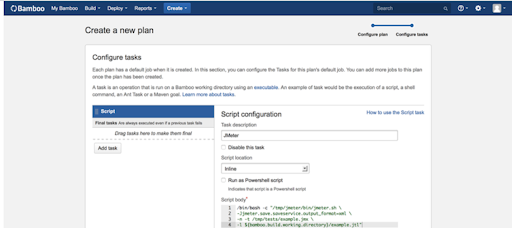
Now, your task configuration should look like the image below. Just make sure you change the settings above to match your JMeter and test script locations.
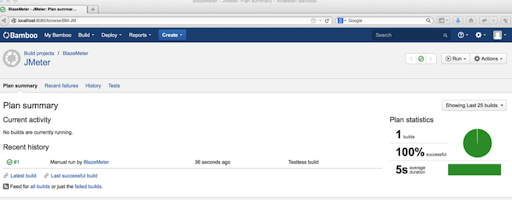
At this stage, it’s a good idea to run the first build to ensure that it passes successfully. Ideally, you should see something like this:
Now let’s configure the Bamboo JMeter Aggregator plugin so it can track performance trends and conditionally fail the build based on key metrics and KPIs. The plugin configuration is performed in the “Miscellaneous” tab of the Bamboo Job, which contains the JMeter tests. That is where you can specify the location to look for the JMeter result files and set arbitrary assertions:
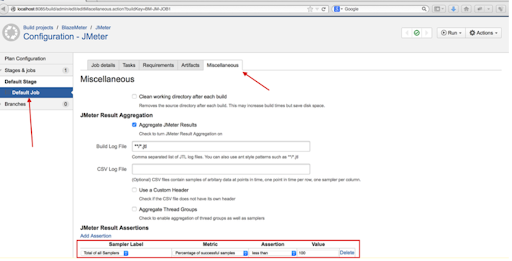
I recommend setting the “Build Log File” value to: **/*.jtl. When combined with the ${bamboo.build.working.directory} variable, it will configure Bamboo to store the JMeter test results along with the build working folder and you’ll be able to monitor performance trends across consecutive builds of your application.
Once you’re all set, run your build plan a few more times to get initial statistics. The results of the Bamboo JMeter Aggregator plugin can be found in the “Load Test Reports” tab on your build plan dashboard.
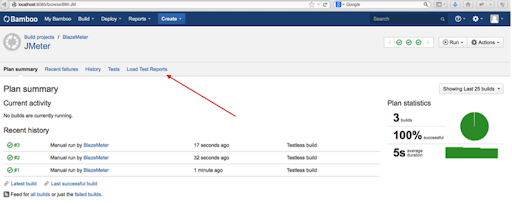
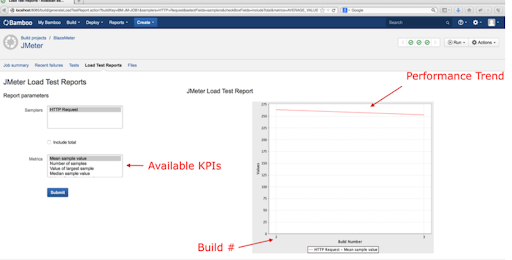
If you click the “Load Test Reports” link, you’ll get to the JMeter Load Test Reports page. Here you’ll be able to see graphs on metrics and KPIs of your choice and monitor how these values change from build to build.
Integrating JMeter Load Tests into Bamboo CI
Now you should be ready to integrate JMeter load tests to your Continuous Integration process with Bamboo.
To schedule your tests to run periodically, e.g every night, you can use a cron-based schedule. This schedule is configured using the Schedule editor. The schedule can be daily (times per day), weekly (days per week), monthly (days per month) or based on a cron expression.
To schedule a plan build using a cron expression:
- From the Bamboo header select Build > All build plans.
- Locate the plan in the list and select the edit icon to display the plan’s configuration pages.
- Select the Triggers tab, then select either an existing trigger or Add trigger.
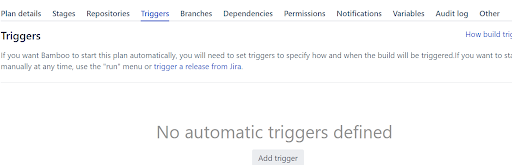
- Select the Scheduled trigger type.
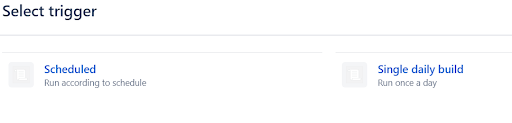
- Optionally, enter a trigger description.
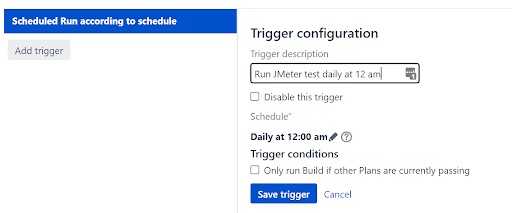
Select save trigger. And your Bamboo continuous integration tutorial with JMeter is complete!
Bottom Line
CI/CD, coupled with automating your load tests, is a faster, more productive, and cost-saving approach for shipping new product features and enhancements with minimum risk for the production environment. As you saw in this Bamboo continuous integration tutorial, you can use Bamboo to automate your CI/CD pipeline with JMeter and decide on the acceptance of new builds to move forward in the development life cycle.
Source: https://www.blazemeter.com/blog/jmeter-bamboo-continuous-testing-tutorial